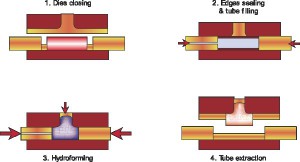
Tube Hydroforming (THF) consists of a tube expanded in a hollow die by a pressurized media. The tube is placed in closed dies and its edges are plastically deformed by two punches, one of which is hollow and allows to inject pressurized liquid into the tube so expanding it. The sealing and the material feeding are guaranteed by two punches that plastically deform and then push the tube edges. THF is characterized by tooling and assembly costs reduction and by part mechanical properties, weight and dimensional accuracy improvement (1-3). Moreover, with respect to traditional forming processes, the lower development time and the higher production rate make THF suitable for automotive field, in particular in tubular components, engine cradles, radiator supports or nozzle productions (4). The most important parameters that influence the results in tube hydroforming are the optimal combination of the internal pressure and axial feeding vs. time, the sheet and tube material properties and the friction between workpiece and die (1). In fact, if the most common defects (wrinkling and bursting) depend on the right definition of the pressure and punch strokes curves, they are actually related to the amount of fed material (too much or few respectively) that depends on the friction acting on the tube walls. Previous studies conducted on the phenomenon (5-10) investigated the relation between THF and friction showing how, at the tube-die interface, the lubrication conditions influence the final characteristics of a Y-Joint hydroformed tube in terms of expansion of the bulged zone
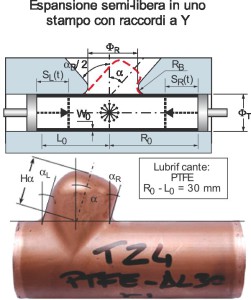
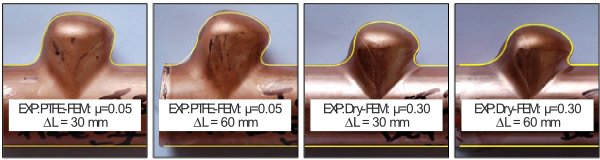
and thickness distribution. In particular, through an experimental campaign it was shown how it possible to influence the final part geometry controlling the friction conditions during the process. In the experiments (Figure 2), a partial die was used and it was studied how asymmetric friction conditions can lead to a spontaneous Y-joint forming whose shape (namely bulge height H∝ and slope∝) can be controlled increasing or not the friction asymmetry . The friction asymmetry was obtained using different feeding zone lengths (L0 and R0). In this work, a FEM model based on the conducted experiments was developed, validated and used to study an actual Y-joint tube hydroforming process. It will be shown how the asymmetric friction conditions affect the process, in particular how it can be used to improve the die filling.
Fem model and simulations
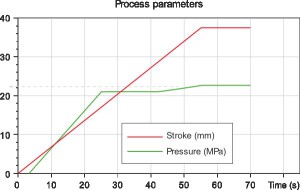
The model was developed using PamStamp 2G® explicit finite element software. Shell elements were used for the part mesh; die and punches were modeled as rigid and the tube as plastic objects. Part geometries, pressure and punch stroke curves were the one adopted in the previous experimental tests (12) and are reported in Table 1 and Figure 3.
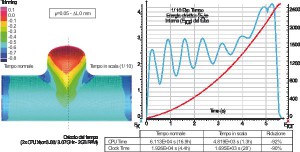
In particular, due to the die geometry, the pressure curve is characterized by a low calibration pressure (pCAL, t [55;70] s) in order to avoid a “mushroom” final tube geometry. The experimental tests were conducted in Dry and PTFE lubrication conditions and the associated tube-die friction coefficients were chosen on the base of previous works (12). Once the model was validated, it was used to simulate and to optimize a full-die Y-Joint tube forming with a slope = 10°. During the model design, particular attention was given to the die mesh and to the computational time reduction. The die is in fact characterized by a small fill-in radius (RB = 2 mm). Therefore, in order to better simulate the material flow and contacts, a fine mesh of the die was adopted in this zone (Figure 4).
Moreover, being the hydroforming cycle time significantly long, the time was scaled by a factor of 1/10. This should not affect the forming process since the temperature is cold, but could lead to numerical instability problems. In order to exclude these effects on the model, different simulations were run using both the normal and the reduced time scales and then the results were compared in terms of final part characteristics and tube energy.
Results and discussion
Before performing the whole simulations campaign, it was verified the independency of the results from the adopted time scale reduction. The tube final profile and thickness distribution were considered to exclude the material flow influence, while the tube kinetic-internal energy ratio was considered to exclude the numerical instabilities. Figure 6 shows the results when a semi-free expansion die is adopte. It can be
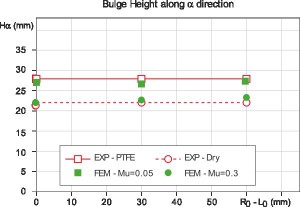
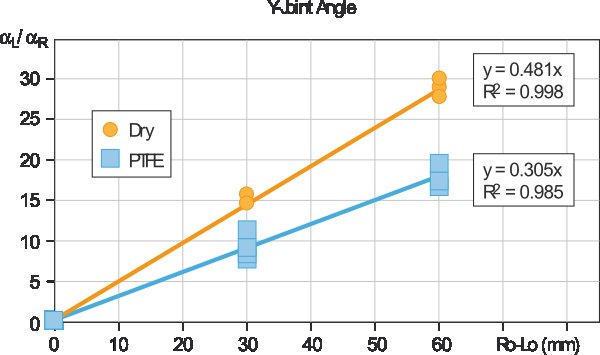
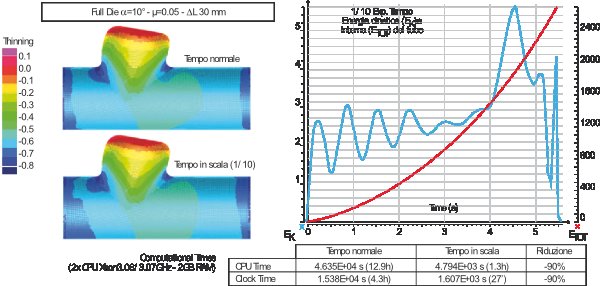
observed that the time scaling does not affect the simulations results, as showed by the good overlapping between the final tube characteristics and by the tube kinetic energy (EK) that represents a very small percentage of the total tube energy (ETOT). Finally, the simulation run time was compared showing a significant reduction of the computational time proportional to the process time reduction and equal to more than 90%. That allows to compute a simulation in less than half an hour (on a double CPU Xeon 3.06/3.07 GHz, 2GB RAM). Once the model approximation effects were evaluated as non significant, the simulations campaign was performed. The results were compared with experimental ones in terms of final tube geometry ( and H according to Figure 2). The typical final tube profile is reported in Figure 7 were it can be observed that the simulation results well fit the experiments except in the proximity of the fill-in radius RB (owed to a tube and die nodes touching/detouching condition errors). For this reason, the simulations and the experiments were numerically compared in terms of bulge height H (Figure 5) while for the slope it was possible only a qualitative comparison. It can be observed that there is a good overlapping with the experimental results in term of H and (Figure 7). The developed model was then used to simulate a full-die Y-joint tube hydroforming. It was chosen an = 10° Y-joint geometry (Figure 8) under good lubrication conditions (PTFE, = 0.05). A counter punch was introduced to contain the expansion in the bulge height direction so to improve the die filling. The use of a closed die allowed to use a calibration pressure higher than the one previously adopted (pCAL in Figure 3). Different asymmetric conditions (L = 0 – 30 – 60 mm) were tested and the results were compared in terms of final part formability, in particular it was compared the die filling as the calibration pressures changes (pCAL = 40-50-60 MPa) in terms of final tube-die distance. In Figure 9 it is possible to observe that when proper asymmetric friction conditions are adopted, the die filling is improved, in particular (pCAL = 40) the best die filling results are obtained when the L = 30 mm is adopted, as suggested by the experimental results of the semi-free expansion tests reported in Figure 10 (12). In fact, the proposed asymmetry related to the adopted process conditions (PTFE and = 10°) is equal to L = R0 – L0 = 32.8 mm. When the calibration pressure increases, the die filling is generally improved but a symmetric condition (L = 0 mm) or a too high asymmetry (L = 60mm) give always the worst results in terms of die filling. For this reasons, the identification and the adoption of the proper asymmetric friction configuration can be useful to reduce the maximum needed forming pressure (i.e. calibration pressure) for THF components, especially when high yield strength material are formed. Finally, it was verified that the time scaling did not affect the results comparing two simulations with and without the time scaling and performed using an asymmetry L = 30 mm and a calibration pressure pCAL = 50 MPa. The results did not show any difference in the tube final geometry and the tube kinetic/internal energy ratio did not showed any sign of induced numerical instabilities (Figure 11).


