 According to siderweb and the think tank of entrepreneurs and scholars who drew up the report industry and steel 2030, steel, due to its sound presence in a broad range of applications in our daily life, will face an unavoidable evolution.
Anticipated already at the half of last year and officially presented in the context of Made in Steel 2015, meeting with the several protagonists of the steel and iron panorama on stage last May in Milan, Industry and Steel 2030 is a complete research about topical issues and prospects of the sector in a critical time. The research has estimated that the international steel output grew by 24% «in the years following the crisis»: but that percentage is inferior «to the increment of consumptions (+30%) that has reduced the demand-offer gap from 116 to 67 million tons. While in China, in India and in the Africa-Middle East macro-region the production respectively grew by 90, by 7 and by 3%, in the North-West of the world we have witnessed an average decrease of four percentage points. Europe lived the 13% volume decrease, North America the 6%.
If we analyse consumptions, the manager of the study division of Siderweb, Gianfranco Tosini has foreseen that in 2030, in the old Continent, they will probably rise from 244 to 285 million tons, against 264 in 2008. In the most advanced North-American regions they are likely to shift from 111 million tons of last year to 117, against 113 of seven years ago; while in the Central-Southern regions of the New World the surge is constant: from 61 to 71; up to 96 million tons. Asia, instead, deemed of interest especially for «Chinese steel enterprises and those of Asian developed nations» according to a policy of export and direct investments, will express with Oceania the demand for 1.3 billion tons. Africa, which in 2008 absorbed 27 millions, in 2030 will jump to 156 million tons; whereas the Middle East would be ready to absorb, at the same date, 70 millions (51 in 2014).
Electric future
Having considered that the electric furnace evolution – characterized by «minor investment costs, higher plant flexibility, decrease of the duration of the melting process, diminished environmental impact» – is decisive for Italy, the study has analysed its global diffusion. It was then possible to notice that the steel implemented with this technology, 28% of the total in 2014, in 15 years will amount to 42.5%, corresponding to 406 million tons, by over 90% «ascribable to rising Countries» where the incidence of EAF production will be by 42% «compared to the current 23%». In this survey, the People’s Republic of China is an exception, since «it will remain the area with the lowest percentage of steel produced with electric furnace (19%)». Considering, however, that in India and in the other Asian outsiders the production based on Electric arc furnace «will exceed 180 million tons», it is foreseeable that Asian rising Countries will host two thirds of the output deriving from this type of process. While the remaining portion might be reasonably ascribed to Middle East and Africa. The dynamics will affect the performance of raw materials, with the metallurgical coke ready to rise from one to 1.2 billion tons already at the end of this decade and the carbon coke flying towards 1.5 height, if «all the projects of productive capacity increase were implemented». Just this unknown has suggested a cautious behaviour to Gianfranco Tosini and the «realistic» forecast of an offer worth 1.25 billion tons of coke starting from 2020, «with China, Australia, Confederation of Independent States and North America» deemed as its primary suppliers.
United States at full steam (of shale)
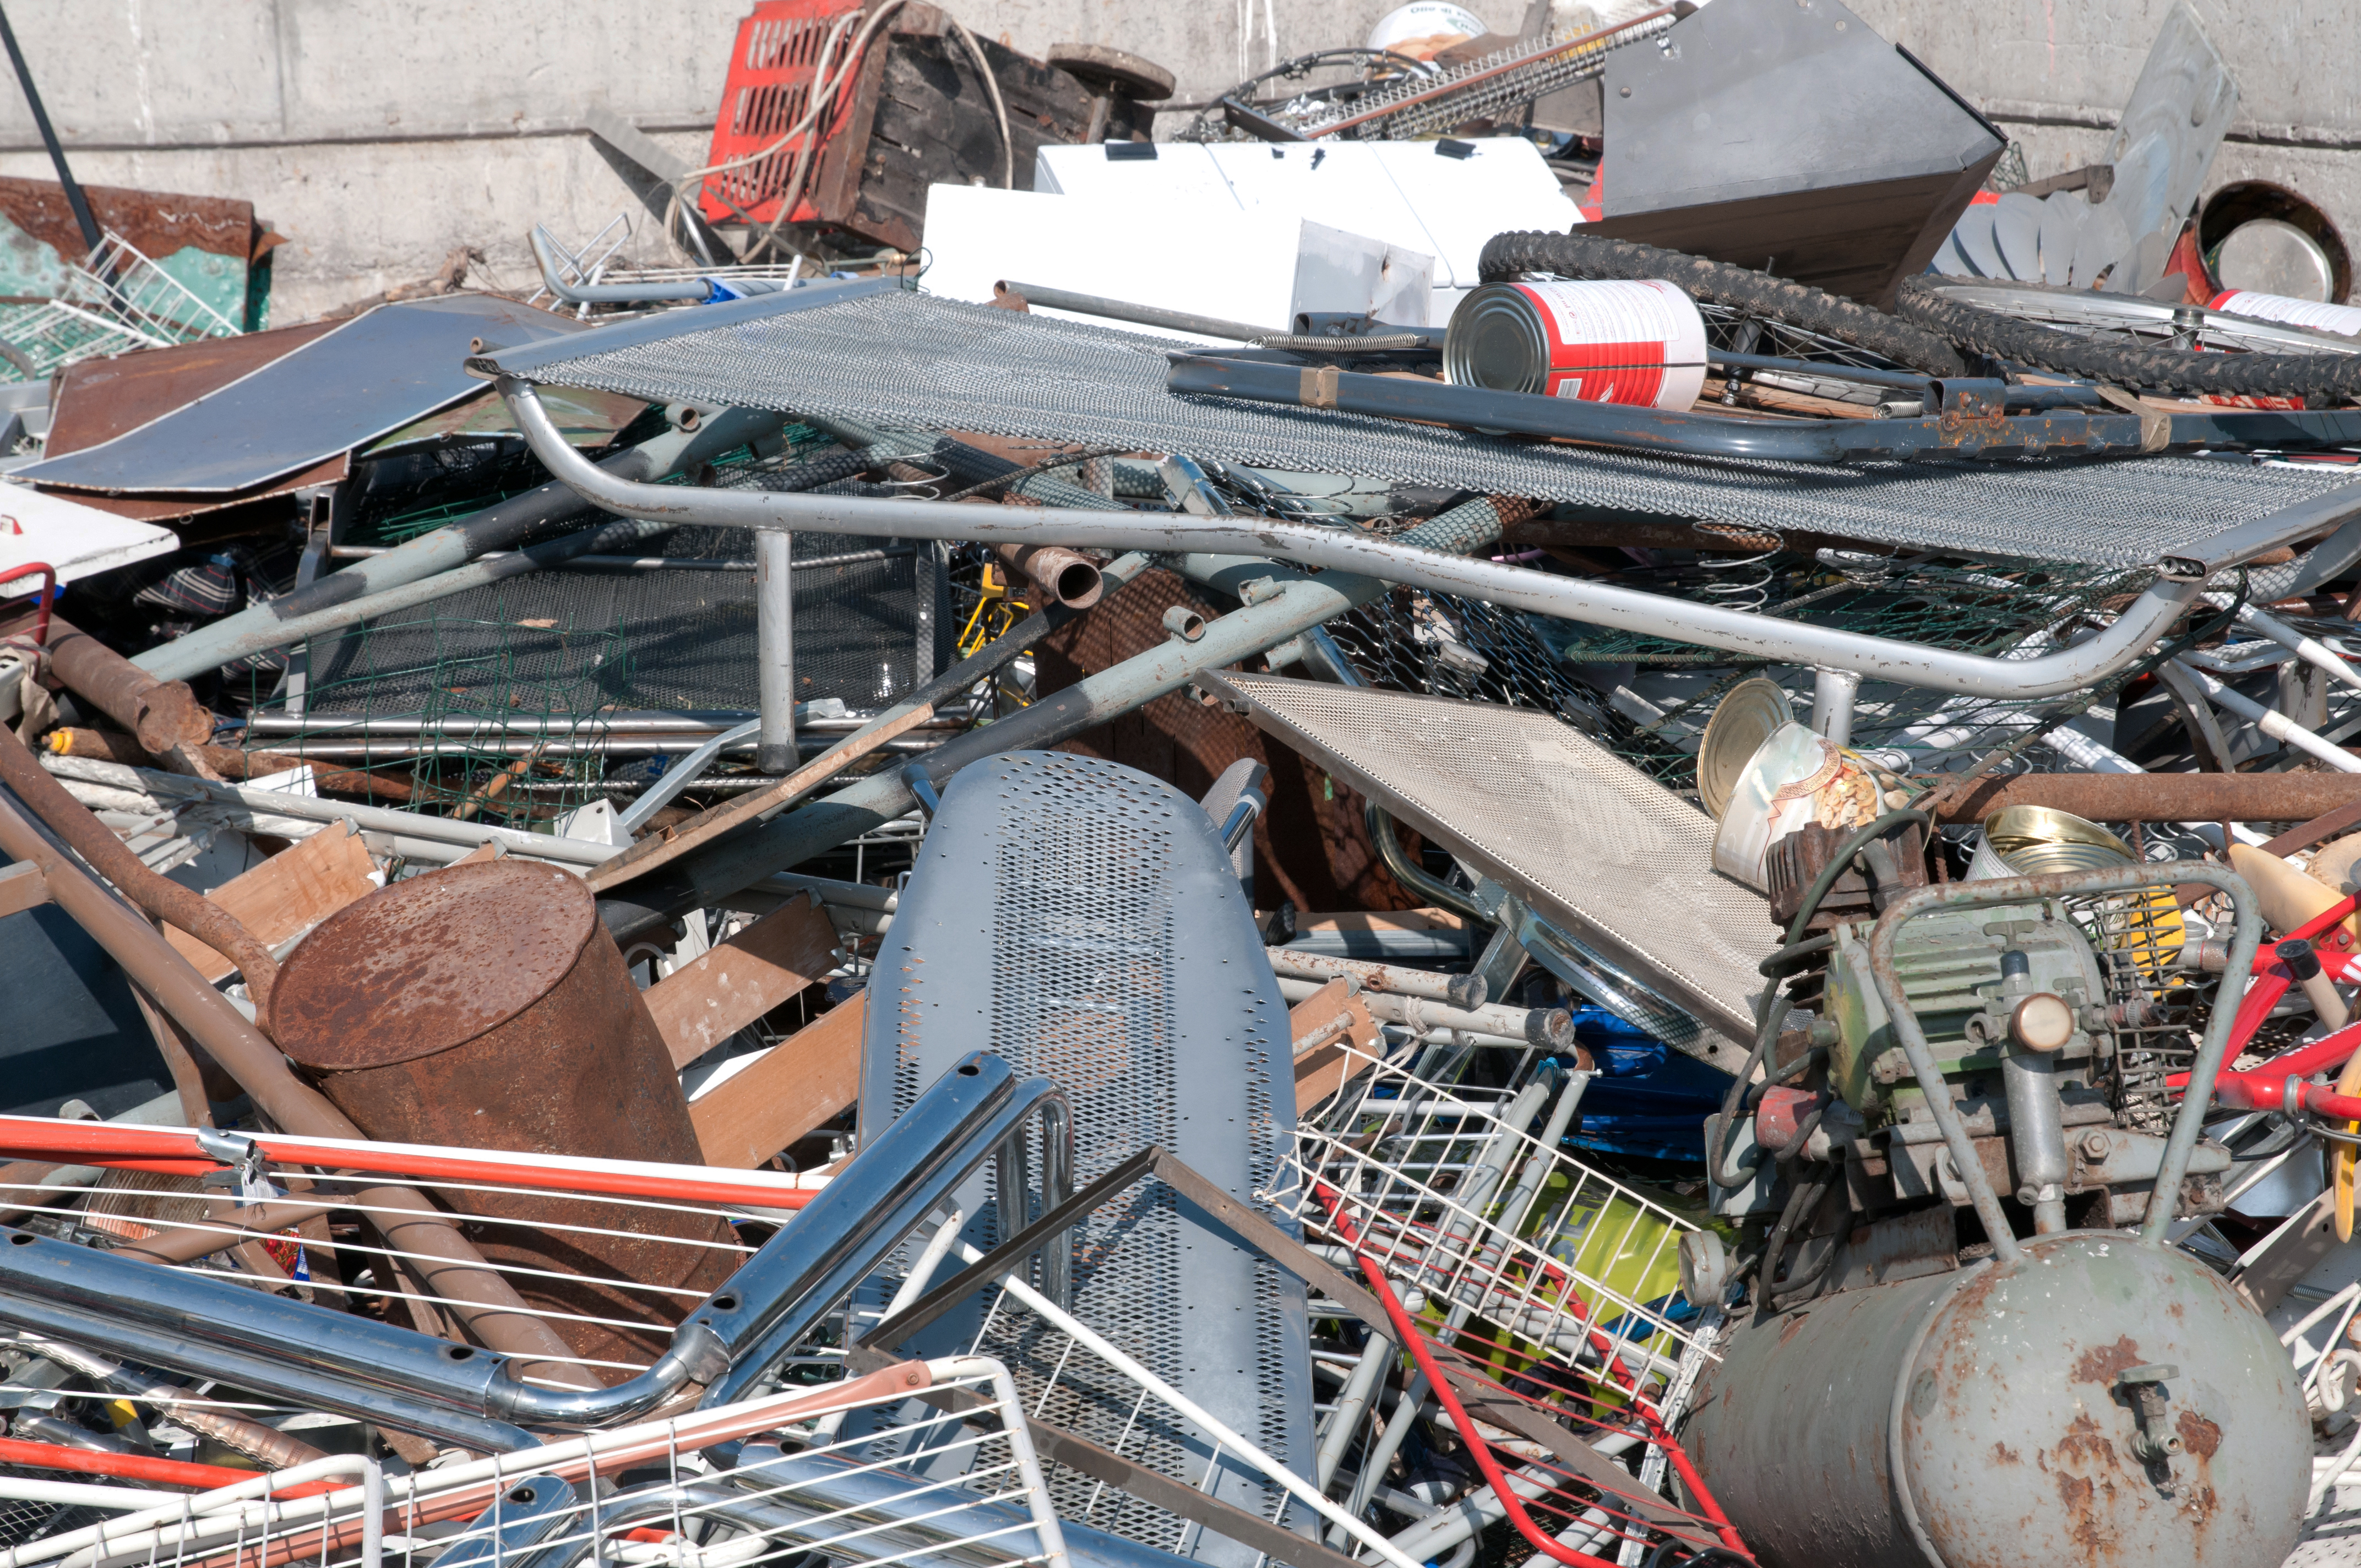
Different the situation of scrap, whose demand seems to be increased by the already mentioned rise of the production based on EAF. «Considering that the yearly availability of scrap can be estimated of around 70% of the apparent steel consumption of 15-17 years before», reported the research, «this highlights that, in 2020 approximately, strong tensions between demand and offer might occur». Such contrasts should diminish starting from 2021, to reach a phase of «substantial balance» in 2030. Once more, the Dragon’s appetites play a determinant role on the scrap stage, too. They forecast that Beijing will be its net importer for other five years; but «in the successive years, it will gradually become net exporter, thanks to the notable rise of the available scrap» on the territory. And this in virtue of the recycling of steel products purchased and discarded by the population in the boom era (2004-2013). Almost the opposite, from this point of view, the trend of Europe and in particular of its historical drivers. The most advanced Countries in the Union will maintain their status of net scrap exporters until 2025 («thanks to the income resulting from the high historical consumptions of steels and from the limited growth of demand for this raw material by iron and steel enterprises»). The drop of the demand occurred from 2008 to 2013, therefore in the years of the most clamorous recession, will unavoidably weigh on the future of the EU, which therefore addresses a future of net importer. Decreasing, according to expectations, also the export from North America, which might anyway reverse the trend and increase the scrap sales abroad without affecting the production with electric furnace «thanks to the possibility of producing DRI at competitive prices» given by the shale gas. «The upsurge of the shale gas production», pondered the study division manager of Siderweb, «strengthening the competitive position of the United States industry in terms of energy costs, might constitute a reason for attracting new investments in the iron and steel industry in the United States» in this way diminishing the weight of «net imports» by Obama’s nation.
Applications sectors want a different steel
In surveying the segments that traditionally absorb the most conspicuous parts of the steel output, Gianfranco Tosini from Siderweb also examined the technological changes that they will impose to suppliers in time. The automotive, «which today absorbs 12% of the steel produced in the world», goes towards the reduction of weights, which coincides with the decrease of emissions and consumptions and for this reason it exacts high-strength materials of first (AHSS) or second generation (TWIP: Twinned induced plasticity). Heavier than other alternative materials, such as aluminium, carbon fibres and reinforced polymers, they have anyway the advantage of granting a better weight/resistance ratio. Lightness and corrosion resistance are essential requisites also in the energy segment: «The extreme operational conditions», typical for instance of off-shore applications, will highly enhance the popularity of «low-alloy weld-free steel pipes with medium-low carbon». Or, moreover, in the harshest environments «instead of stainless martensitic, duplex or super-austenitic steel» can find applications pipes made of «carbon steel with internal protective coating because cheaper». Concerning finally mechanical engineering, it consumes 24% of steel and in its turn will be concerned by changes that will influence the steel industry, too. In the ambit of the supply chain, the trend is towards the reduction of stocks, «compliant with just in time production logics». While steel will be expected to provide «high mechanical resistance even at high temperatures»; «to the stresses resulting from sliding and abrasion; excellent toughness in the resistance to collisions; the low deformability in presence of temperature changes», even the most significant; and last but not least, according to the report, «the high resistance to corrosion».
Apparent steel consumption for finished products in the various world areas
| Areas/Countries | 2008 consumption | 2014 consumption | 2030 consumption | |||
| Million tons | % | Million tons | % | Million tons | % | |
| EUROPE | 264 | 21.5 | 244 | 15.3 | 285 | 14.0 |
| Developed Countries | 167 | 13.6 | 129 | 8.1 | 155 | 7.6 |
| Rising Countries | 47 | 3.8 | 54 | 3.4 | 66 | 3.2 |
| Independent State Community | 50 | 4.1 | 61 | 3.8 | 64 | 3.1 |
| AMERICA | 174 | 14.2 | 182 | 11.4 | 213 | 10.4 |
| North America developed ones | 113 | 9.2 | 111 | 7.0 | 117 | 5.7 |
| North rising and Centre-South Countries | 61 | 5.0 | 71 | 4.4 | 96 | 4.7 |
| AFRICA AND MIDDLE EAST | 76 | 6.2 | 88 | 5.5 | 226 | 11.1 |
| Africa | 27 | 2.2 | 37 | 2.2 | 156 | 7.6 |
| Middle East | 49 | 4.0 | 51 | 3.3 | 70 | 3.4 |
| ASIA AND OCEANIA | 713 | 58.1 | 1081 | 67.8 | 1318 | 64.5 |
| Developed Countries | 167 | 13.6 | 153 | 9.6 | 161 | 7.9 |
| China | 447 | 36.4 | 768 | 48.2 | 786 | 38.5 |
| India | 51 | 4.2 | 76 | 4.8 | 180 | 8.8 |
| Other rising Countries | 48 | 3.9 | 84 | 5.3 | 191 | 9.3 |
| Total of developed Countries | 447 | 36.4 | 393 | 24.6 | 433 | 21.2 |
| Total of rising Countries | 780 | 63.6 | 1202 | 75.4 | 1609 | 78.8 |
| TOTAL | 1227 | 100 | 1595 | 100 | 2042 | 100 |


