by Maciej Orman and Cajetan T. Pinto
This paper presents a method for the acoustic analysis of electric motors in noisy industrial environments. Acoustic signals were measured via acoustic camera 48-microphone array, which has the capability to localize a sound (or sounds) source and, in turn, separate those sounds from intrusive background noise. These acoustic analysis results are then compared with vibration measurements; vibration monitoring is a well-known and established technique used in condition monitoring, and in this work vibration measurements were used as a reference signal for assessment of the value of the acoustic measurements. Vibration signals were measured by piezoelectric accelerometers. Two induction motor cases were examined: a healthy motor case, and a combination of static eccentricity with soft foot case. As shown, acoustic analysis appears to be a valuable technique for condition monitoring of electric motors, particularly in noisy industrial environments.
Introduction
Since any interruption in the manufacturing process can cause a serious financial loss for the company, it is very important to prevent unplanned shutdowns of electric machinery. Hence, monitoring and diagnosing the health of electric motors is crucial, and continues receiving more and more attention. One of the possibilities for performing diagnostics of electric machines is by analysing sound emitted by object of interests. The quality of acoustic monitoring is very much dependent on the background noise of the environment in which the machine is operated. Some attempts to create condition-monitoring methods based on acoustic analysis were made in the past (Refs. 1-4). Recently, acoustic analysis has attracted more and more attention, and has been applied in many fields – speech recognition, for example. However, condition-monitoring methods based on acoustic analysis are still considered difficult to implement in an industrial environment due to the background noise.
The easy availability today of data collectors and sensors as accelerometers or current probes drives the use of many condition-monitoring systems based on those measurements. However, it is still very often the case that site engineers are asking for inspection of the machine when they notice abnormal sound. Instead of isolation of the sound and its analysis, a typical “solution” is to perform measurements of vibration, current, temperature or voltages that are not always indicative of the problem. Even though what was reported was abnormal sound, existing solutions are trying to detect the fault by various types of measurements, as opposed to showing that sound is emit- ted by a specific part in the first place. This, in turn, might limit the amount of possible diagnostic decisions, thus limiting the amount of required effort. For this reason, in many cases the first diagnostic attempt is made by highly experienced engineers who are able to initially detect and diagnose the problem by simply listening for the sound source. For many years, diagnostics in the industry were performed “by ear,” with subsequent assessment of the emitted sound. Still, the influence of background noise can strongly affect the quality of such a judgment.
Today’s trends in the job market lead to a situation where there is less and less people who are experienced enough to judge the condition of an object by listening to the sound it makes. It is the result of the fact that many people prefer to do office work rather than working in an industrial environment. As is shown, in the Global Employment Trend document (Ref. 5), or in the list of the top 10 jobs forecast for next decade (Ref. 6), this situation will be even more prevalent in the future. However, there remains a necessity of doing the initial investigation of objects to localize the abnormal sound to perform immediate action.
A solution of the described problems might lie in the usage of acoustic analysis for objects-of-interest diagnostics. Thus far, it has been relatively difficult to create a reliable, acoustic-based condition monitoring system due to the fact that sound measurements are always affected by background noise. However, recent technologies like acoustic cameras are able to successfully localize specific sound components and thus remove the influence of such noise (Refs. 7–8).
A variety of faults that can occur in induction machines have been extensively studied and many monitoring methods have been proposed to detect problems (Ref. 9). Most of those methods for condition monitoring of electric motors utilized vibration or motor current signature analysis (MCSA) (Refs.9–11). While vibration and cur- rent signature analysis-based monitoring techniques are well known and well-accepted, acoustic measurements are not so popular in industrial application. This paper describes a diagnostic method for induction motors based on acoustic measurements, while vibration analysis is used as a reference for assessment of the value of acoustic measurements.
Measurements Tools
Acoustic camera. The idea of the acoustic camera is to do sound source identification and quantification, and to create a picture of the acoustic environment through the processing of the multidimensional acoustic signals received via microphone array and to overlay that acoustic picture on the video picture (Ref. 7). Other possible acoustic camera applications include use as test equipment for non-destructive measurements for sound identification in vehicle interiors and exteriors (Refs. 7–8 and 12); trains and airplanes (Refs. 13–14); and for measurement in wind tunnels, etc. Additionally, some studies show the application of acoustic camera for unmanned underwater vehicles (Ref. 15), robots and robotized platforms, etc. It can also be used for passive acoustical sensing in battlefield environments (Ref.16). In this work, a 48-microphone acoustic camera was used for sound measurements; parameters for the microphones are presented in Table 1. Acoustic holography technique was used for analysis of the sound source. Acoustic holography technique is a method that is used to estimate the sound field near a source by measuring acoustic parameters away from the source via microphone array. This is a well-known technique and its description can be found in (Refs. 16–17).
Vibration measurements. Vibration measurements are one of the most popular methods for condition monitoring of electric motors. Typically, piezoelectric accelerometers are used for measurements of the vibration. For the purpose of the present work, vibration measurements were taken as a reference for the sound measurements. Vibrations were collected with ABB’s MACHsense-P condition monitoring tool. MACHsense-P is a walk- around condition monitoring service tool provided by ABB that specifically focuses on electric motors. Vibration signals were measured using 4 simultaneous data capture channels and analysed for mechanical and electromagnetic defects. The frequency range used for analysis by MACHsense-P tool is from 0 Hz to 12,800 Hz. The vibration analysis presented in this paper is embedded functionality in the MACHsense-P tool.
| Table 1 – Microphone characteristic | |
| Parameter | Value |
| Equivalent noise level: | 27 dB(A) |
| Maximum equivalent sound level: | 130 dB |
| Microphone Frequency response: | 20 Hz–20 kHz |
| Table 2 – Nameplate of motors | |
| Parameter
Active power [kW] |
Value
75 |
| Nominal voltage [V] | 690 |
| Nominal current [A] | 77.5 |
| Nominal power factor [-] | 0.86 |
| Nominal speed [rpm] | 1480 |
| Winding connection [-]
Number of poles per phase winding [-] Nominal frequency [Hz] |
Y
2 50 |
Measurements Analysis and Comparison
All vibration and acoustic measurements where done in an industrial environment. Since induction motors are the most widely used machines in industry (Ref. 18), two of the same type three-phase induction motors were chosen. Nameplate details of the motors are presented in Table 2.
Both motors were located relatively close to each other, and both of them were driving centrifugal pumps of the same type through direct coupling. Both motors where operating at the same load level. Motor case 1 is considered healthy while motor case 2 is considered to have a combination of static eccentricity and soft foot. As soft foot typically results in static eccentricity, this combination of faults is very common.
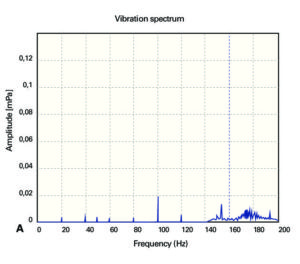
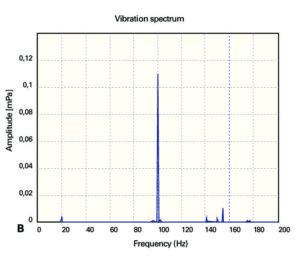
Results based on vibration measurements. For both of the motor cases, vibration sensors were located horizon- tally on the center of the body of the motors. Figure 1A presents a vibration spectrum of the healthy motor case while Figure 1B presents a vibration spectrum of a combination of static eccentricity and soft foot motor case. Since static eccentricity can be typically visible in low-frequency range, both figures present frequencies from 0 Hz to 200 Hz. You may notice that Figure 1B contains a high peak – at around 100 Hz. The value of this peak is above 0.12 gs, while in Figure 1A this peak is smaller than 0.02 gs. As presented in (Ref. 12), static eccentricity causes additional forces visible in vibration at frequency fecc – given by following equation:
fecc = 2 ∙ fline
Where fline is power supply frequency. In the above case, both motors were supplied by 50 Hz; therefore static eccentric-related frequency fecc is visible at 100 Hz. By taking the amplitude of fecc frequency as the static eccentricity indicator, it is clearly visible that the motor in case 2 reached a higher level of static eccentricity than the healthy motor from case 1. With the MACHsense-P the indicator of static eccentricity is calculated automatically.
Figure 1
Results based on acoustic measurements. For industrial applications, when performing measurements using a microphone, background noise can- not be avoided. The background noise can be filtered out by post-processing methods of the measured signals. This is possible due to the different nature of the measured sound. The background noise (including the aerodynamic noise of the cooling device) is usually a broadband signal with a more or less constant spectrum (Ref. 1). On the contrary, the induction machine generates sound that is characterized by many pure tones – at least for the sound produced by electromagnetic origin. Reference 1presents a method where before operating the induction machine, a measurement of only the background noise is conducted. This spectrum of the measurements is later subtracted from the measured spectrum, with the induction machine in operation. However, this noise filtering approach is not accepted in industry because it affects the industrial process.
Reference 11 describes a method that isolates the frequencies related to the motor presented in electric current measurements. The same approach can be applied for vibration or acoustic signal. As presented in (Ref. 11), by knowing motor parameters and motor slip, all the frequencies related to motor condition can be identified. Likewise, all motor-related frequencies can be found and identified in the acoustic signal, even if the signal contains back- ground noise.
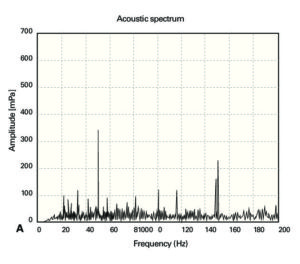
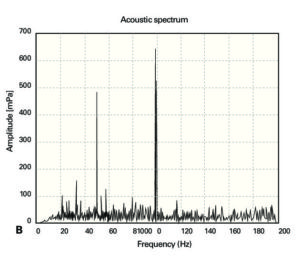
Figure 2 presents an acoustic spectrum of average signal via microphone array. Figure 2A presents acoustic spectrum of a healthy motor case, while Figure 2B presents an acoustic spectrum of a combination of static eccentricity and soft foot motor case. Both figures are obtained for frequencies ranging from 0 Hz to 200 Hz. Similar to vibration cases, it is possible to notice that Figure 2B consists of a high peak at around 100 Hz, while Figure 2A does not. Value of this peak is above 600 mPa, while in Figure 2A this peak is smaller than 350 mPa. Those results are very similar to vibration-based results, and they are clearly indicating static eccentricity; however, in case of acoustic signal there is no assurance that this frequency emanates from the motor.
To solve this problem, the acoustic holography technique can be applied to find the sound source of the frequency of interest, in this case, 100 Hz.
Figure 2
Conclusions
In this paper, an acoustic-based technique for the condition monitoring of electric motors was presented. Vibration analysis was used as a reference for assessment of the value of acoustic measurements. Acoustic measurements were performed via 48-microphone acoustic camera. Two induction motor cases were examined a healthy motor case and a combination of static eccentricity with soft foot case. For fault case, respective frequencies were identified in both vibration and acoustic signal. Based on acoustic holography technique, the fault-related acoustic frequency source was localized in the center of the body of the faulty machine. As presented in the results section, one can say that acoustic signals can be successfully used for condition monitoring of electric motors in noisy industrial applications. Obviously, single acoustic signal is disturbed and noisy compared to vibration signals; therefore sound localization technique via acoustic camera was needed to solve this problem. An additional benefit of sound analysis is the fact that the acoustic sensors need not be attached directly to the motors, which is often difficult in industrial applications.
Article from Power Transmission Engineering, June 2016, pp. 48-51
References
[1] Van Riesen D., Schlensok C., Henrotte F., Hameyer K.: “Acoustic measurement for detecting manufacturing faults in electrical machines”, 17th International Conference on Electrical Machines ICEM, (2006)
[2] Verma S. P.: “Noise and vibrations of electrical machines and drives; their production and means of reduction”, International Conference on Power Electronics, Drives and Energy Systems for Industrial Growth, Vol. 2, pp.1031, 1996
[3] Verma S. P., W. Li: “Measurement of vibrations and radiated acoustic noise of electrical machines“, Sixth International Conference on Electrical Machines and Systems ICEMS, Vol. 2 (2003), pp. 861
[4] Gaylard, A., Meyer, A., Landy, C., A. “Acoustic evaluation of faults in electrical machines “, Seventh International Conference on (Conf. Publ. No. 412), Durham, p. 147 -150
[5] Employment Trends unit of the ILO Employment Sector, “Global Employment Trends 2012: Preventing a deeper jobs crisis”, International Labor Office, Geneva, 2012.
[6] WorldWideLearn “Top ten jobs”, WorldWideLearn.com Copyright, Quinstreet Inc., 2012.
[7] Miljko M.Eric., 2011, Some Research Challenges of Acoustic Camera, 19th Telecommunications forum Telfor,Page(s):1036-1039
[8] Ulf Michel, “History of acoustic beamforming”, Berlin Beamforming Conference (BeBeC) 2006, 21-22. Nov.2006
[9] Tavner P.J., 2008, Review of condition monitoring of rotating electrical machines, IET Electrical Power Applications, Vol 2(4), Page(s): 215-247
[10]Orman M., Orkisz M., Pinto C. T., 2011, Slip Estimation of a Large Induction Machine Based on MCSA, Diagnostics for Electric Machines, Power Electronics & Drives (SDEMPED), IEEE International Symposium on, Bologna, pp. 568 – 572, 2011
[11]Orman M., Orkisz M., Pinto C. T., 2011, Parameter identification and slip estimation of induction machine, Elsevier, Mechanical Systems and Signal Processing, Vol 25, Page(s): 1408-1416
[12]S.Guidati, “Advanced beamforming techniques in vehicle acoustic”,Berlin Beamforming Conference (BeBeC) 2010.
[13]C.Cariou, O.Delvedier “Localizing aircraft noise sources with large scale acoutic antenna” 27th International congress of the aeronautical sciences
[14]J.S.Pascal, J.F.Li “Use of double layer beamforming antenna to identify and locate noise in cabins, EURONOISE, Finland, 2006
[15]Hans-Elias de Bree, Jelmer Wind, Erik Druyvesteyn, “Battlefield Acoustic”, Microflown ebook, chapter 21
[16]Korpel Adrianus, “Acoustic imaging and holography”, IEEE Spectrum, Volume: 5 Issue: 10, pp. 45 – 52, 1968.
[17]Mueller, R.K. “Acoustic holography”, Proceedings of the IEEE, Volume: 59 Issue: 9, 1971
[18]Long Wu, “Separating Load Torque Oscillation and Rotor Faults in Stator Current Based-Induction Motor Condition Monitoring”, Georgia Institute of Technology, 2007.
[19]M.Mijic, D.Masovic, D.sumarac Pavlovic and M. Adnadevic, “A Model of Planar Microphone Array Realized with Low-cost Multimedia Microphones”, Telecommunications Forum (TELFOR), pp. 1040 – 1043, 2011.

